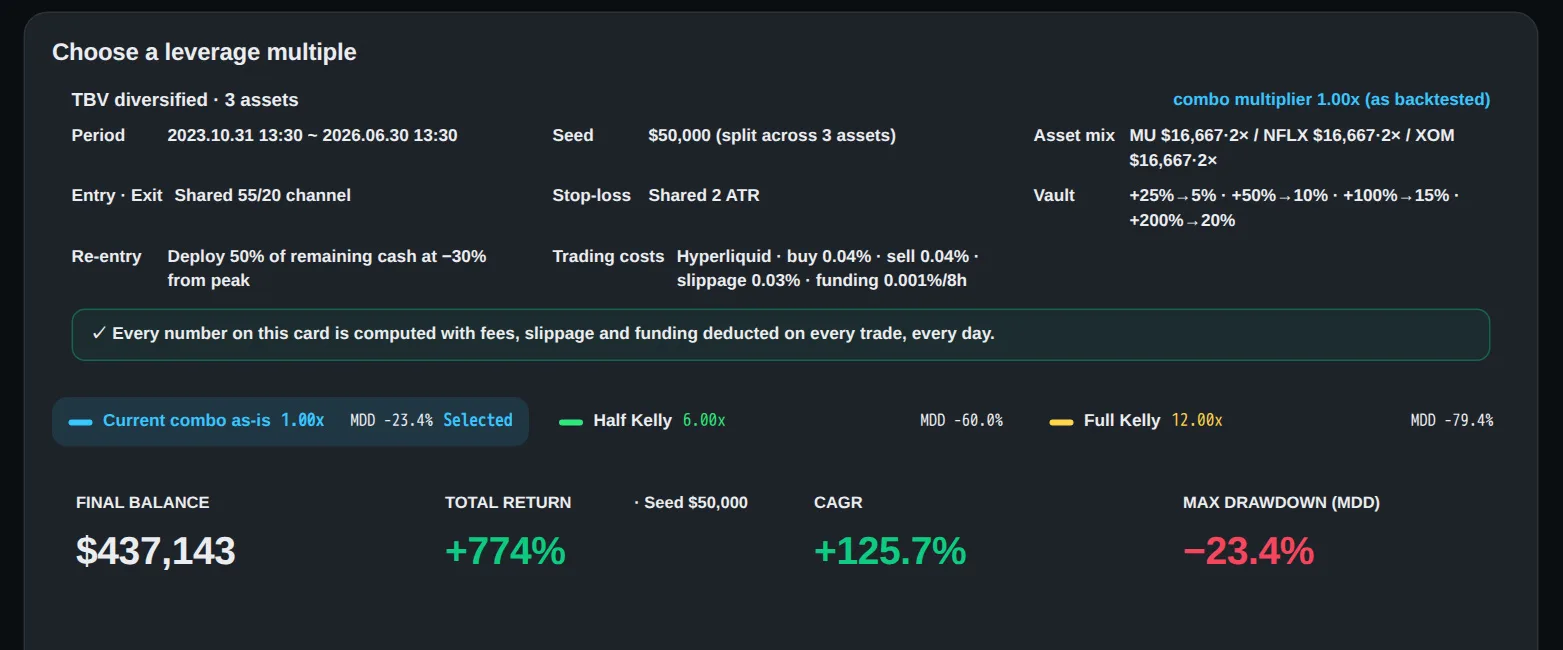
In October 2023, I put $50,000 into three stocks and let one trend-following strategy make every call. By June 2026, that account hit $434,944, up 770% in 2.7 years, per my TanQuant backtest. Just holding the same three stocks would've ended at $336,778. So what was the strategy doing differently? Here's the setup, the trades, and the pain along the way.
How was the $50,000 split across the three stocks?
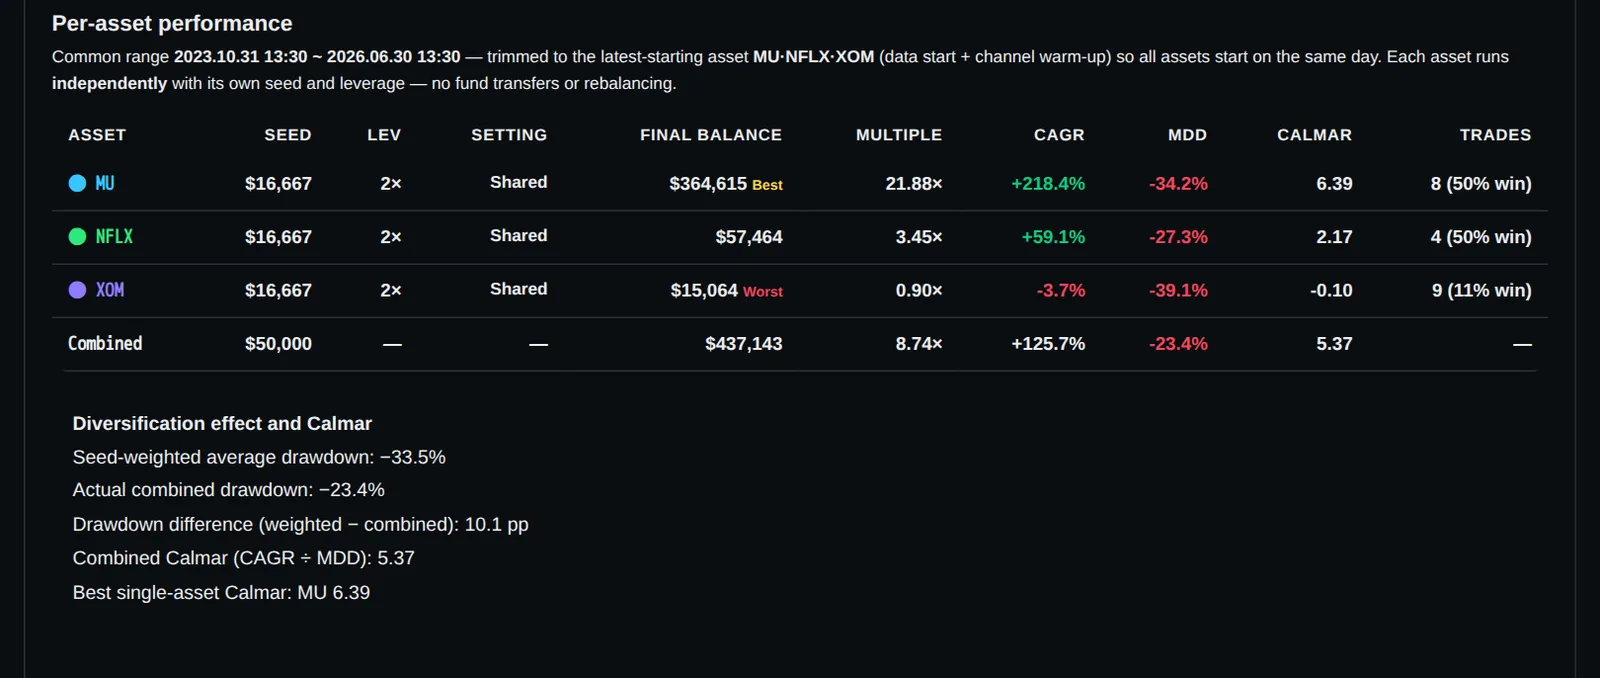
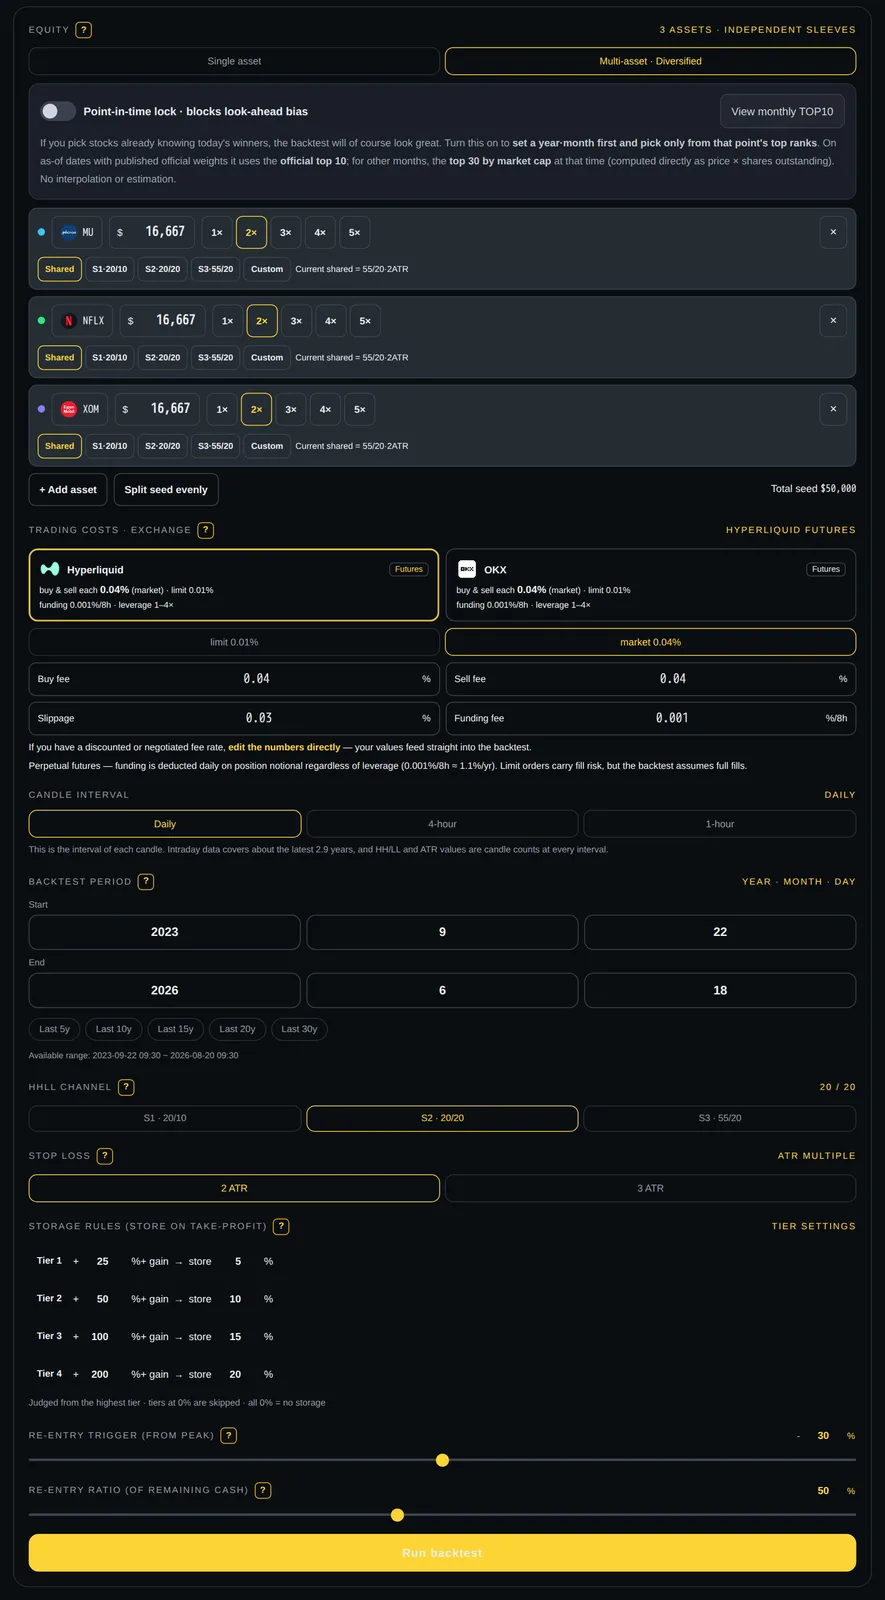
The money went in three equal slices of $16,667 each: Micron (MU), Netflix (NFLX), and ExxonMobil (XOM). All three positions ran at 2x leverage.
From there, I didn't make any calls myself. One trend-following strategy decided every entry and every exit.
What rules does this Turtle trading strategy follow?
It's a compounding version of the Turtle system. Pure trend-following.
- Entry: it buys only when price breaks above its 55-bar high.
- Exit: it sells when price slips below the 20-bar low.
- Timeframe: each bar is 4 hours.
- Risk: every position carries an ATR stop (a stop-loss sized to the stock's volatility).
- Profits: gains get moved into a separate vault instead of being bet again.
How did it make money with only 7 winning trades out of 21?
Over those 2.7 years, the strategy traded 21 times. Only 7 were winners. The other 14 lost.
It still made money because trend-following keeps losers small and lets winners run. You don't need to be right often. You need the few right calls to be big.
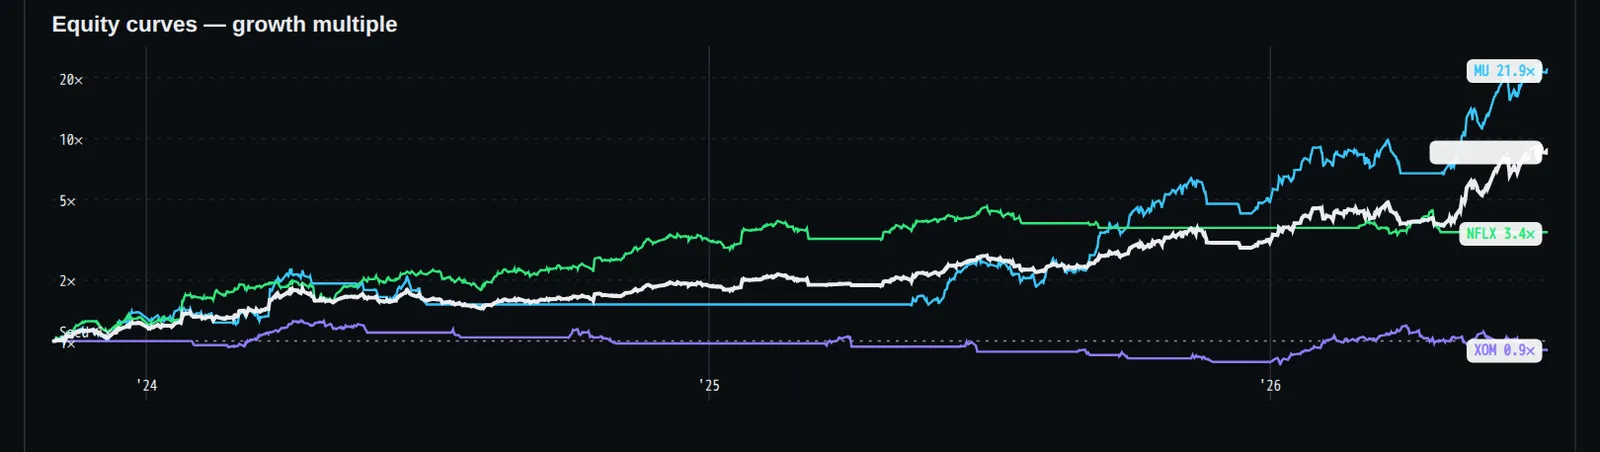
Micron shows this best. Its $16,667 slice grew to $362,473, up 2,075%. That one stock carried most of the account.
What were the weak spots: max drawdown and the Calmar ratio?
It wasn't flawless. ExxonMobil finished down 10%. And on April 23, 2026, the whole account sat 23.4% below its peak.
That number is MDD (max drawdown): the deepest fall from a high. It's the pain you'd have had to sit through.
The Calmar ratio came in at 5.36. It's annual return divided by MDD, so it shows how much return you earned per unit of pain. I read that as strong.
Key numbers at a glance
- Start: $50,000, October 2023 ($16,667 each in MU, NFLX, XOM, 2x leverage)
- End: $434,944, June 2026 (up 770% in 2.7 years)
- Buy-and-hold of the same three stocks: $336,778
- Trades: 21 total, 7 winners, 14 losers
- Best performer: Micron, $16,667 → $362,473 (up 2,075%)
- Worst performer: ExxonMobil, down 10%
- MDD: 23.4% (April 23, 2026)
- Calmar ratio: 5.36
One honest note: these three stocks came from a random draw. I tested 500 combos, 172 passed my risk filters, and this one had the best Calmar. It's a past test, not a buy list.